RISK, 7-2 Feb.1994, pp. 139-145, pp. 32-39
The market implied volatilities of stock index options often have a skewed structure, commonly called “the volatility smile.” One of the long-standing problems in options pricing has been how to reconcile this structure with the Black-Scholes model usually used by options traders. In this paper we show how to extend the Black-Scholes model so as to make it consistent with the smile.

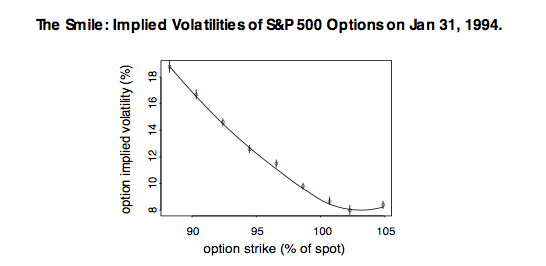
The Black-Scholes model assumes that the index level executes a random walk with a constant volatility. If the Black-Scholes model is correct, then the index distribution at any options expiration is log- normal, and all options on the index must have the same implied vol- atility. But, ever since the ’87 crash, the market’s implied Black- Scholes volatilities for index options have shown a negative relation- ship between implied volatilities and strike prices – out-of-the-money puts trade at higher implied volatilities than out-of-the-money calls. The graph above illustrates this behavior for 47-day European-style March options on the S&P 500, as of January 31, 1994. The data for strikes above (below) spot comes from call (put) prices.
By empirically varying the Black-Scholes volatility with strike level, traders are implicitly attributing a unique non-lognormal distribu- tion to the index. You can think of this non-lognormal distribution as a consequence of the index level executing a modified random walk – modified in the sense that the index has a variable volatility that depends on both stock price and time. To value European-style options consistently by calculating the expected values of their pay- offs, you then need to know the exact form of the non-lognormal dis- tribution. To value American-style or more exotic options, you must know the exact nature of the modified random walk – that is, how the volatility varies with stock price and time.
In this paper we show how you can use the smile – the prices of known, liquid, European-style index options of all available strikes and expirations – as inputs to deduce the form of the index’s random walk. More specifically, we show how you can systematically extract, from the smile, a unique binomial tree for the index corresponding to the modified random walk mentioned above. We call this the implied tree. When you use this tree to value any of the options on which it is based, it produces values that match the observed market prices.
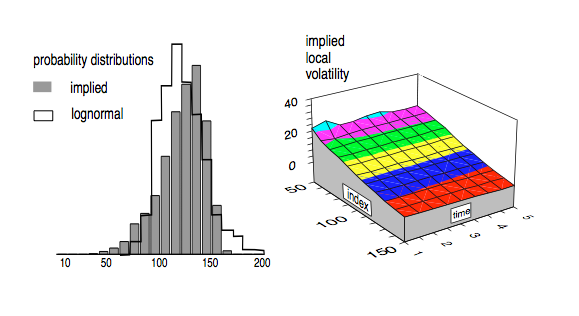
From this tree you can calculate both the distribution and the volatil- ity of the index at future times and market levels, as implied by options prices. The chart below illustrates some of the information that follows from the implied tree.

You can use this implied tree to value other derivatives whose prices are not readily available from the market – standard but illiquid European-style options, American-style options and exotic options that depend on the details of the index distribution – secure in the knowledge that the model is valuing all your hedging instruments consistently with the market.